Consult the following links to learn about what the scenario might be if a Loma Prieta-sized earthquake happened on a fault near you. Each section below contains a video outlining the potential casualties and potential damages that could occur in such a scenario, followed by detailed PDF documents explaining the possible outcomes in correlation with the time of day the earthquake could occur. Click on any image to download the full size file (MOV and PDF files).
These products were developed by SCEC Undergraduate Studies in Earthquake Information Technology (USEIT) Program interns. USEIT is supported by the National Science Foundation Research Experience for Undergraduates Program and the University of Southern California. Significant support for USEIT interns has come from the USC Department of Earth Sciences, USC Undergraduate Research Associates Program, Pasadena City College, and East Los Angeles College.
| Scenario Animation | Scenario ShakeMap | Economic Losses | Estimated Injuries and Fatalities | ||
| 2:00 PM | 5:00 PM | 2:00 AM | |||
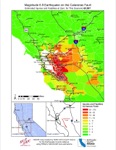
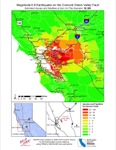
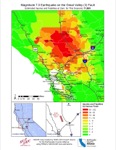
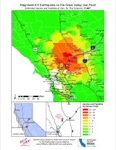
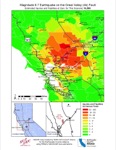
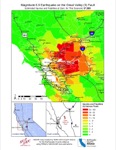
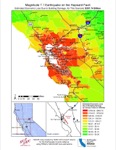
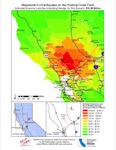
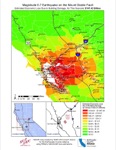
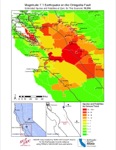
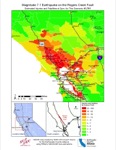
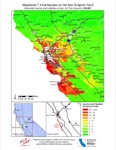
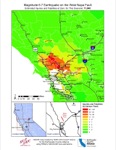
| Bartlett Springs Fault, M7.3 | 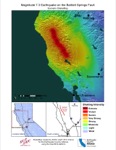 |
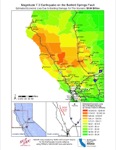 $9.84 Billion |
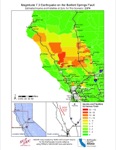 2,574 |
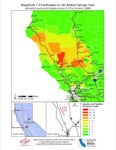 2,055 |
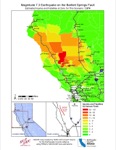 1,974 |
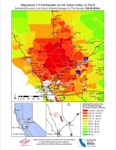
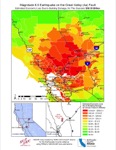
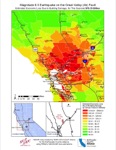
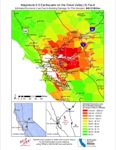
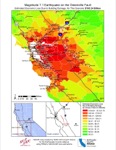
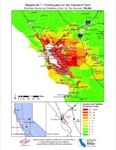
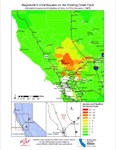
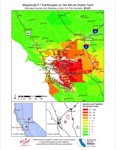
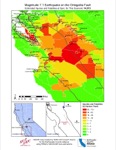
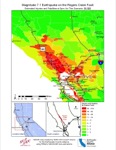
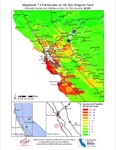
| Calaveras Fault, M6.9 |  |
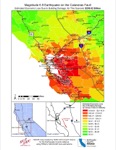 $209.92 Billion |
 121,151 |
 93,615 |
 60,997 |
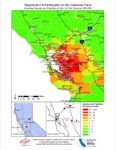
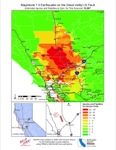
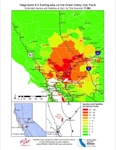
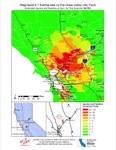
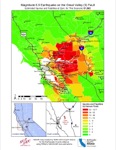
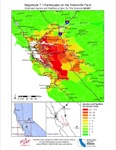
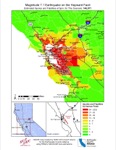
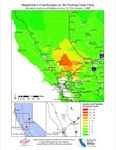
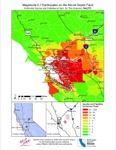
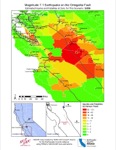
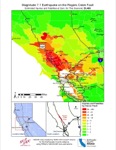
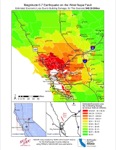
| Concord Fault, M6.8 |  |
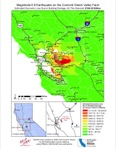 $104.59 Billion |
 73,220 |
 56,602 |
 38,389 |
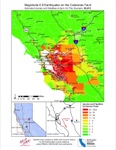
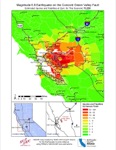
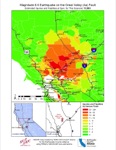
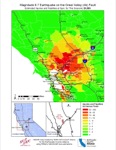
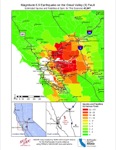
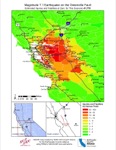
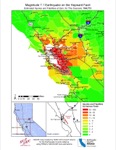
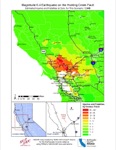
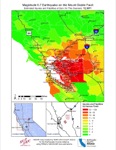
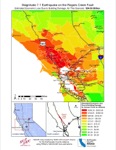
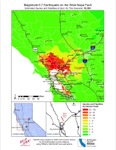
| Great Valley (3) Fault, M7.0 |  |
 $58.86 Billion |
 19,597 |
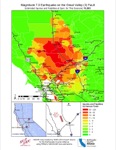 15,503 |
 11,865 |
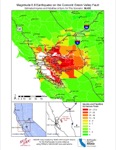
| Great Valley (4a) Fault, M6.6 |  |
 $58.38 Billion |
 17,088 |
 13,993 |
 11,467 |
| Great Valley (4b) Fault, M6.7 |  |
 $76.35 Billion |
 24,725 |
 20,085 |
 16,098 |
| Great Valley (5) Fault, M6.5 |  |
 $48.33 Billion |
 51,562 |
 42,847 |
 37,089 |
| Greenville Fault, M7.1 |  |
 $163.24 Billion |
 87,805 |
 64,941 |
 41,770 |
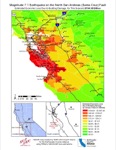
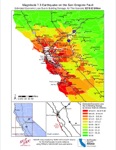
| Hayward Fault, 7.1M |  |
 $301.74 Billion |
 186,849 |
 146,971 |
 104,713 |
| Hunting Creek Fault, M6.4 |  |
 $10.99 Billion |
 1,973 |
 1,657 |
 1,549 |
| Mount Diablo Fault, M6.7 |  |
 $147.42 Billion |
 83,027 |
 164,272 |
 123,871 |
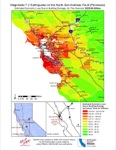
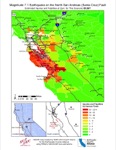
| North San Andreas (North Coast) Fault, M7.5 |
 |
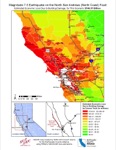 $146.01 Billion |
 95,256 |
 70,414 |
 39,127 |
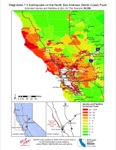
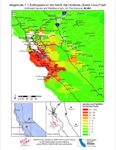
| North San Andreas (Peninsula) Fault, M7.1 |
 |
 $229.86 Billion |
 143,020 |
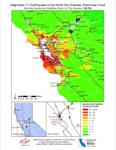 109,335 |
 68,891 |
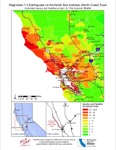
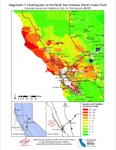
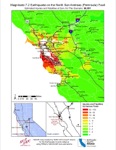
| North San Andreas (Santa Cruz) Fault, M7.2 |
 |
 $154.58 Billion |
 89,967 |
 69,484 |
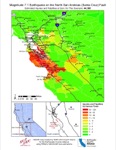 44,380 |
| Ortegalita Fault, M7.1 |  |
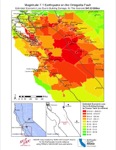 $41.83 Billion |
 18,516 |
 14,013 |
 9,086 |
| Rogers Creek Fault, M7.1 |  |
 $94.06 Billion |
 41,741 |
 33,322 |
 25,465 |
| San Gregorio Fault, M7.5 |  |
 $218.82 Billion |
 138,377 |
 105,087 |
 63,051 |
| West Napa Fault, M6.7 |  |
 $49.26 Billion |
 18,353 |
 14,454 |
 11,040 |